
Accessible Site Speed Metrics - Reporting In Adobe Analytics
published onExample metrics, segments and reports you can create with data collected using the Accessible Site Speed Metrics extension for Adobe Launch
In our first post Accessible Site Speed Metrics - Extension for Adobe Launch, we detailed the process for setting up data collection in Adobe Launch and Adobe Analytics. Here we'll delve into some examples of the types of insights you can create using your data.
The first metrics we want to create are the average timings. The events as they're currently set up give just the overall sum of all timings collected - which aren't very useful without context.
In a perfect world, we'd simply set up our metrics in Adobe's Calculated Metric Builder as Timing Event / Page Views, like so:

With this calculation however, you're running the risk that your event may not be set on each Page View, or that the event was not correctly populated, for example - attempting to populate Page Render Time in your Analytics event before the page has actually rendered will set the value to 0. This results in your metrics being reported inaccurately, they'll be calculated much more favourably than the real figure. To reduce this risk, you can create a segment that includes only hits where your event is properly set.
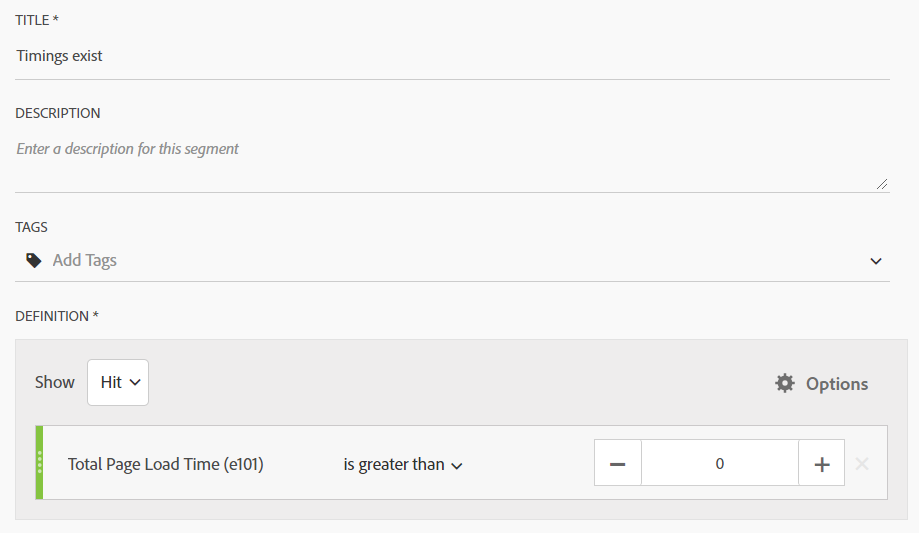
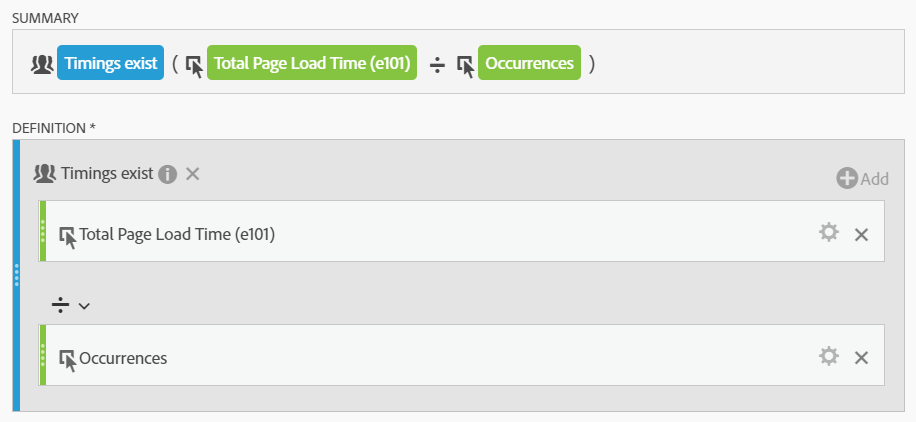
Then use this to build your calculated metric as Timing Event / Occurrences WHERE Timings Exist
Repeat for your chosen metrics, then you can start applying them against any relevant dimension you might choose to create some reports. We've set out a few examples here using Adobe Analytics Workspace.
Applying Avg. Total Page Load Time and Avg. Page Render Time against our URL variable, you can see stark differences between timings of a selection of our pages.
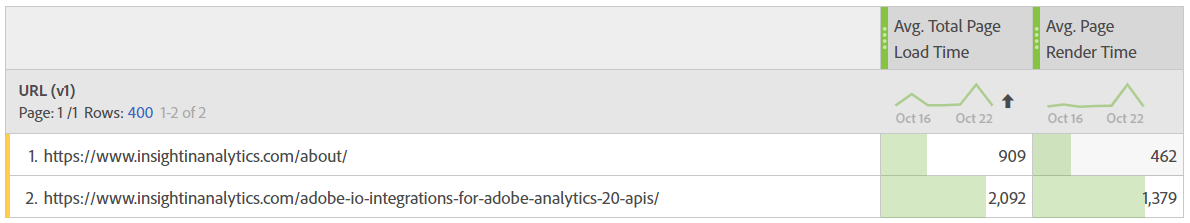
Our lightweight /about/ page renders around 3 times more quickly than an image heavy post page, with obvious knock on effects for the page load time.
If you do business worldwide, an important factor will be whether users on either side of the globe are receiving the same seamless experience across your website. Below is a report showing average server response timings for this website, across a selection of countries.
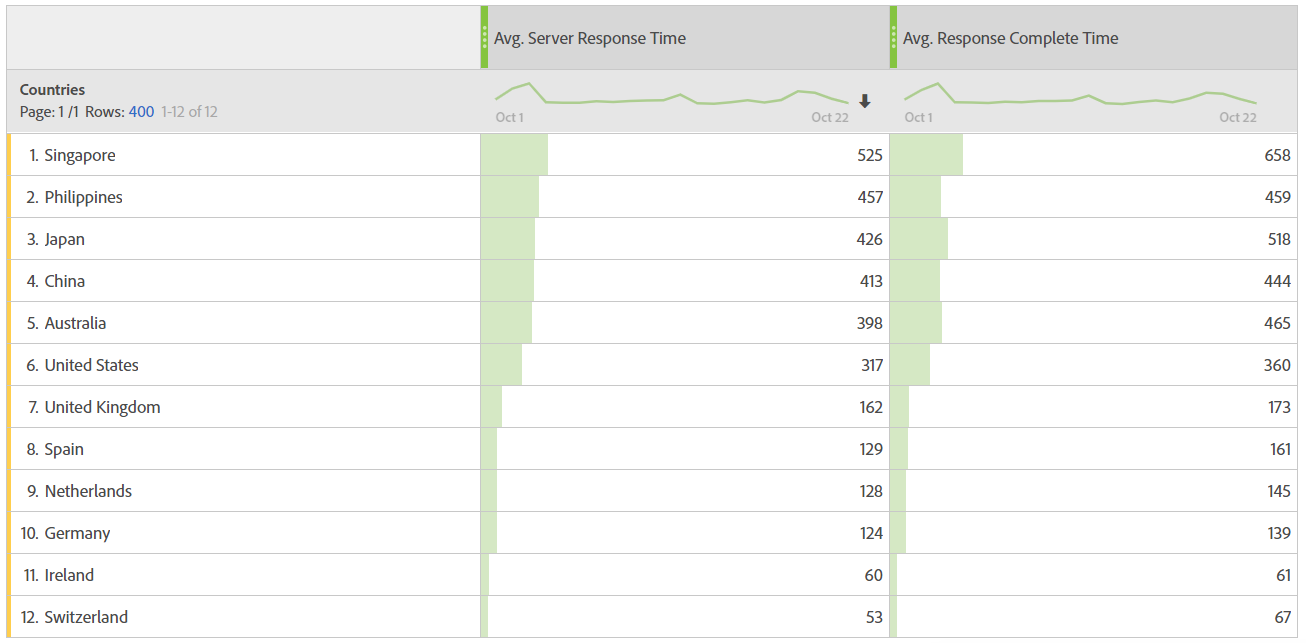
The effects of our not having a globally configured Content Delivery Network (CDN) here are apparent - users based in Europe, where the server is hosted, are able to access the website a lot more quickly than users based anywhere else in the world.
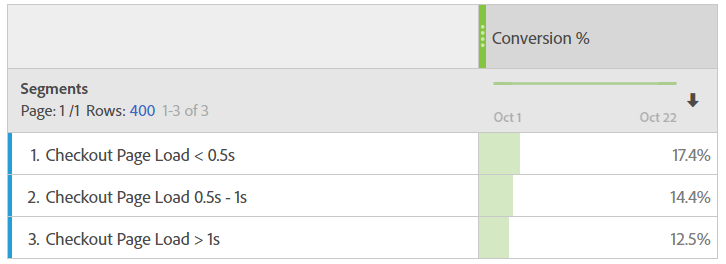
The reports so far allow you to measure the timings, but what effect do these have on user behaviour? In the example report below, we've created three segments based on visits to a shop checkout page, each with differing page load times - less than 0.5 seconds, 0.5 seconds to 1 second, and greater than 1 second. You can define these segments like so:
Less than 0.5 seconds
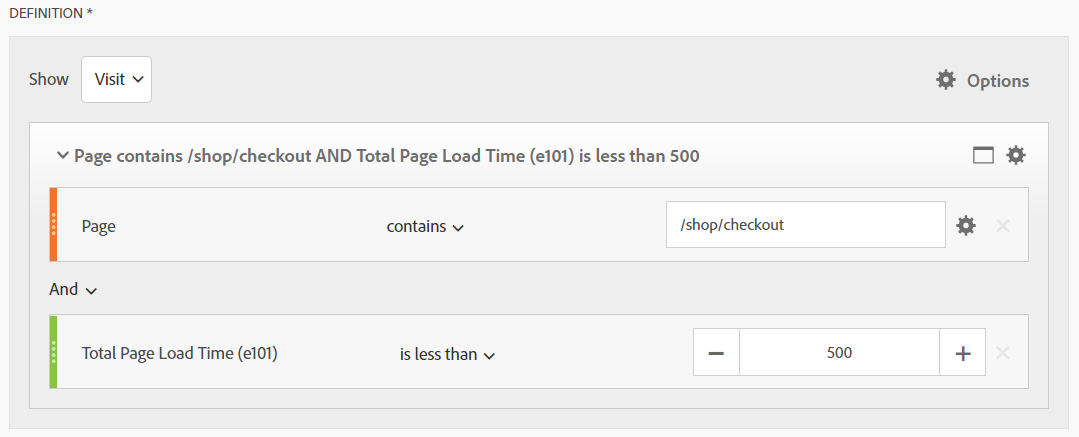
Here, we have a visit segmented to include a view of the checkout page WHERE that checkout page loaded in less than 0.5 seconds. Similarly for your other timings, ensure the segment is scoped to the Visit, but includes a Hit level container with both the page name and timing criteria.
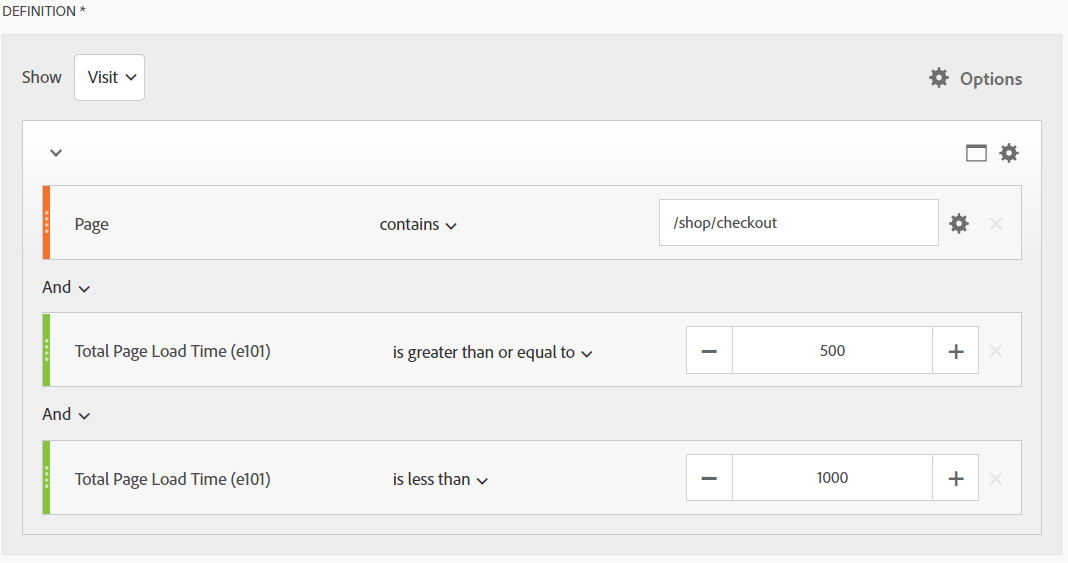
0.5 seconds to 1 second
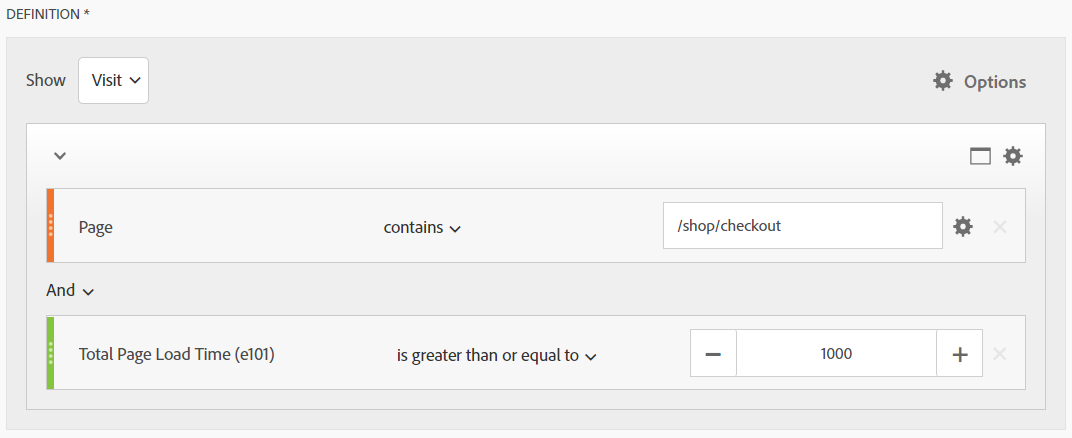
Greater than 1 second
Applying your standard conversion metric (Orders / Visits) to these segments then shows you how users reacted based on their differing experiences.
These highlight a few use cases, but there are endless possibilities for combinations of metrics and dimensions, based on your specific needs. There are some limitations due to Adobe's current lack of support for calculated metrics inside segments, so we're unable for instance to segment based on the user's average time across the whole visit.
(Note: This is a feature marked as 'For Future Consideration' by Adobe here https://forums.adobe.com/ideas/9076, with a detailed explanation by Jen Lasser, Senior Product Owner for Adobe Analytics of the current inability in the comments)
We'd love to know the creative ways you're using your data, and any value you're finding from the insights - feel free to leave us a comment or get in touch!
Comments